

Welcome to Rail Insights, an interactive platform for the rail industry.
Introducing Rail Insights
Rail Insights is a dashboard and analytics platform for the GB rail network. It provides insights into travel demand, station usage, and passenger crowding. It is designed to help operators, planners, and policymakers make informed decisions to optimise operations and enhance the passenger experience.
Features include station analysis, demand for rail travel, and timetable testing, allowing users to evaluate performance, forecast demand, and explore different operational scenarios to improve planning, efficiency, and service delivery.
What can rail insights help with ?
Pulse of Every Station
Station Insights provides detailed analytics on passenger flows, station performance and peak usage trends. From typical daily footfall patterns to identifying how easy it is to reach the station by bus, this tool equips operators and planners with actionable data to optimise station operations and enhance the passenger experience, effectively putting their customer first. Dive deep into individual station metrics or compare performance across the network to ensure every station is meeting the needs of its users.
Understand and Optimise Rail Usage
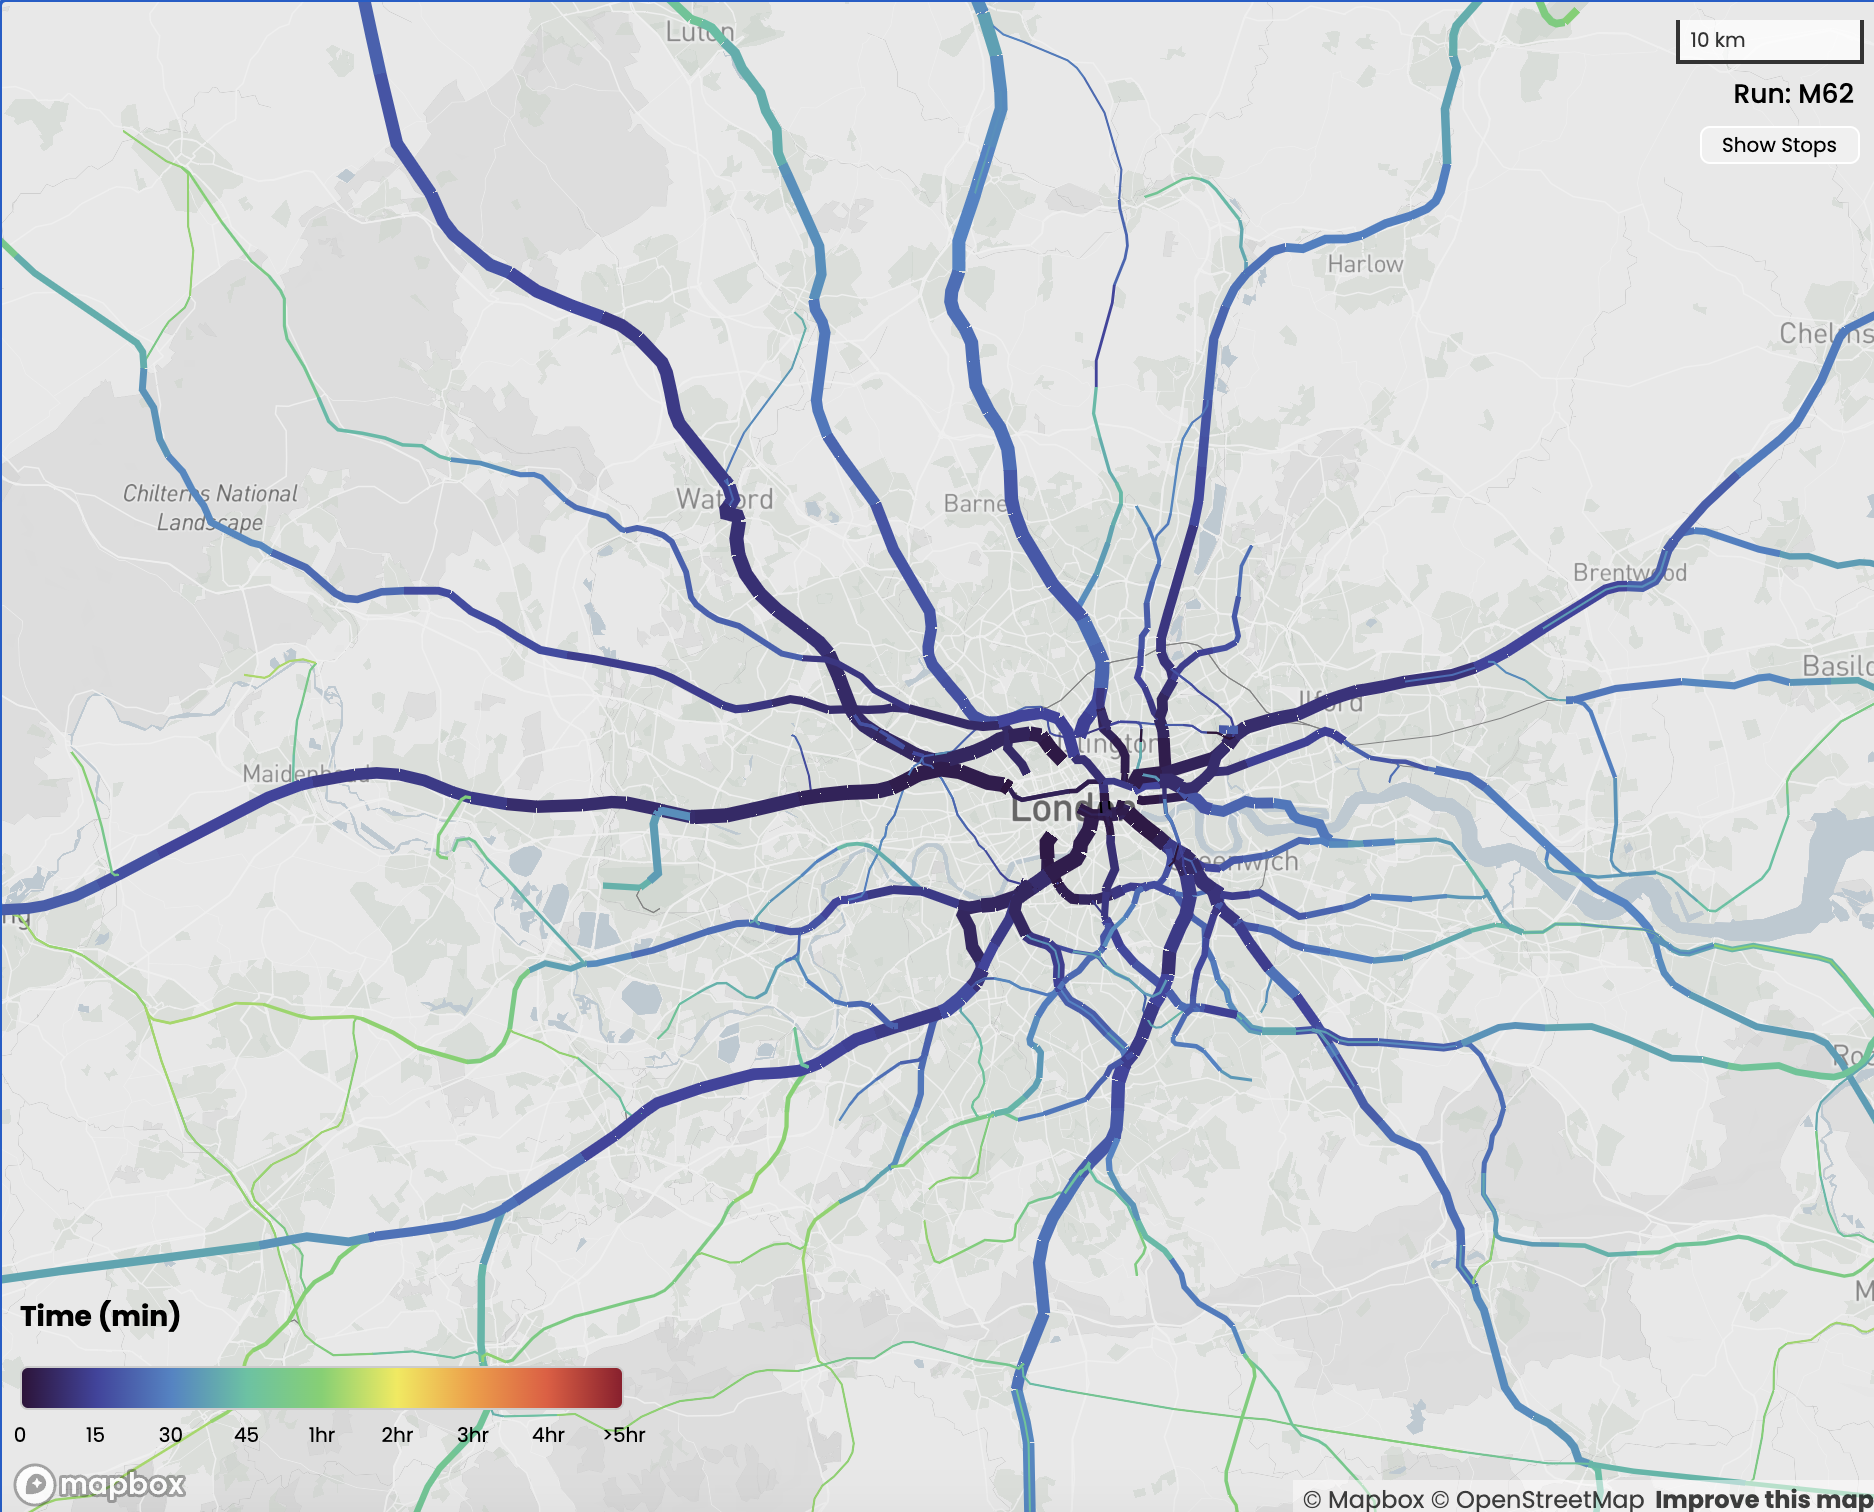
Journey Insights delivers granular insights into passenger demand across the rail network, highlighting key trends in ridership and connectivity. Analyse the utilisation of individual routes and what makes them attractive, identify high-demand corridors and pinch points, and test concept timetables that unlock capacity and connectivity. This module enables operators to adapt to evolving passenger behaviours, improve service reliability, and help decision makers to align strategic investments with actual travel patterns.
Plan for the Future with Confidence
Rail Journey Insights allows users to compare near-term and long-term changes to demand and the network to support strategic planning of our railway. This feature evaluates the impact of new timetables on passenger demand, network capacity, and operational efficiency. By modelling various scenarios, planners can identify the most effective strategies for reducing congestion, improving punctuality, and delivering a better travel experience for passengers, all while minimising the impact of disruptions.
Key features
Rail Insights combines powerful data visualisation and advanced analytics to provide a comprehensive view of passenger demand and journey patterns seen on the GB rail network. Its key capabilities include in-depth station-level insights, rail journey routing, demand analysis, and timetable scenario testing, all powered by geospatial tools.

Station Usage
Station Catchment


Connectivity
Network changes

Demography

Rail Journeys

Want to find out more ?
For more information about Rail Insights or to enquire about accessing the dashboard, please contact us. Our team is available to provide further details and discuss how the platform can support your rail planning and operational needs.
FAQs
Find answers to commonly asked questions
-
For rail travel demand, we start with the Office of Rail and Road (ORR) annual origin-destination matrix from the Rail Data Marketplace. Network Rail uses infrared sensors at managed stations to continuously record footfall, providing a daily profile throughout the year. This data is combined with the ORR dataset to break down annual figures into seasonal and weekday demand matrices.
Network Rail also uses Mobile Network Data (MND) to get a temporal spread of station-to-station flows, showing when people travel by rail. Although we have medium confidence in this dataset, we support it with counts and gateline data where available. MND data is never used in absolute values due to lower confidence at that level.
Using the annual demand matrix, sensor data from stations, and limited MND, we create journey matrices for each day of interest. The simulation engine routes demand through the network, allocating journeys onto trains, trains onto platforms, and eventually generating passenger flow matrices at station level and flow metrics for on-train movements.
A generalised journey time-based routing is used for route choice. This takes into account train schedules, station features, transfer penalties, and includes other public transport like London's tube network.
Note that in the current model versions, train weight, automatic passenger counts (on trains), and green book counts are not used due to sensitivity. However, we can include these in the calibration stage of the simulation to enhance the results if requested on a case-by-case basis.
-
We use census datasets from 2011 and 2021 (2022 for Scotland) for population demographics at the Output Area (OA) area level. Travel to work data from the census indicates the main mode of commute.
Rail Network Line Diagram: Augmented from the Engineers Line Reference (ELR) line diagrams published by Network Rail on the Rail Data Marketplace.
All other metrics, such as crowding, passenger movements, journey times, and connectivity metrics, are results from our simulations.
Train Schedules: Taken from published or in-development timetables, typically ingested in Common Interface Format (CIF) format used in the rail industry.
Bus Schedules: Sourced from Bus Open Data Service (BODS) and Department for Transport (DfT), matching the rail timetable periods and dates. This generates the bus isochrones in station catchment.
-
Passenger Journey Metrics: The dashboard is regularly updated with rail assignment data as we continue to analyse passenger demand and future timetables. For each upcoming timetable change (Dec 2024, May 2025, Dec 2025, etc.), we aim to publish data at least 3 months in advance. However, timelines may be affected by industry dependencies and cross-industry agreements.
We run simulations for each season in advance and also analyse special events, major timetable changes, and engineering works. We collaborate with projects like the East Coast Mainline timetable update and the Trans-Pennine Route Upgrade to view timetable options from a passenger perspective. These are added to a limited access section for project teams to conduct comparative analysis.
Bus and POI Data: Updated biannually.
Connectivity Metrics: Updated biannually, aligned with regulated rail timetable changes.
Demography Data: Updated as adjustments are made to the base data.
-
You can easily download the detailed data behind the visualisations on our platform using the export features. To keep your download manageable, we recommend using the slicers on the platform to narrow down to your specific study area before exporting. Feel free to take screenshots from the dashboard, but don't forget to credit the data source.
We're currently working on an update that will allow you to export map shapes along with the attributes you're visualising. Until then, all data will be exported in a delimited text format, providing the most detailed breakdown for your analysis and visualisation needs. Please note, we do not accept liability for any subsequent use of the data.
Top Tips:Use slicers to limit the size of your download. In the export dialog box, choose if you want the same data cut exported for other locations as well. If you're using the lasso tool to mark your study area and need this for repeated use by your team, we can create custom groups for you in the slicers, making them permanently available.
-
Our platform features a mix of simulated rail journey data and general statistics taken from the Census and land-use characteristics. The simulations undergo rigorous quality assurance by Network Rail’s team, following the DfT’s Business Critical Model framework. If you need more information about data quality, please don't hesitate to contact us.